Skip to content
Back to Blog
19 min read

Fabric Data Agent Accuracy Is a Distribution, Not a Number

I asked a Fabric data agent “What was Queensland’s highest demand over the last quarter?” ten times, each in a fresh conversation. Once it said 8,187.54 MW, which is correct. Nine times it said 5,993.13 MW, a single five-minute interval from 1 October. Across all three wordings it was right 14 times in 30, so for this question a one-off evaluation run is close to a coin toss.

Marc’s post on data-marc.com makes the case for automated tests that store the query producing the expected answer rather than the answer itself. He names determinism as the goal but doesn’t measure it. So I did: 24 questions, three wordings each, ten runs per wording, on real Australian electricity market data, with every stage of the agent’s work captured. Accuracy is a distribution, and the number your evaluation prints is one draw from it.

The rig

The data is AEMO’s aggregated price and demand data: five-minute regional prices and demand for all five NEM regions from January 2025 to September 2026, 918,720 intervals, used with attribution under AEMO’s copyright permissions. It lands in a lakehouse as a small star schema, with a Direct Lake semantic model on top carrying six measures. One data agent has both sources attached.

FABRIC WORKSPACE · F16 · AUSTRALIA EAST AEMO NEM data 105 monthly CSVs 5 regions · 5-min LH_NEM 3 Delta tables 918,720 intervals SM_NEM Direct Lake model 6 measures DA_NEM data agent GPT-5.1 orchestrator · both sources attached · published SQL T-SQL DAX LOCAL PYTHON HARNESS Repeat loop 72 wordings · ×10 (v0) · ×5 (v1) FabricOpenAIResponses SDK judge, turn 2 same conversation, same agent question, new conversation judge prompt DYNAMIC GROUND TRUTH · COMPUTED AT RUN TIME Stored T-SQL → SQL analytics endpoint pandas recompute from raw CSVs Grade · fingerprint each stage official Microsoft Fabric icons · data © AEMO (NEM price and demand, Jan 2025 – Sep 2026), used with attribution
Figure 1. The test rig. Real AEMO data lands in a lakehouse, a Direct Lake model sits on top, and the data agent can reach both. A local harness asks every question in a brand-new conversation, then grades the answer the way evaluate_data_agent does. Expected values come from stored queries run at evaluation time, and every one was cross-checked against an independent recomputation.
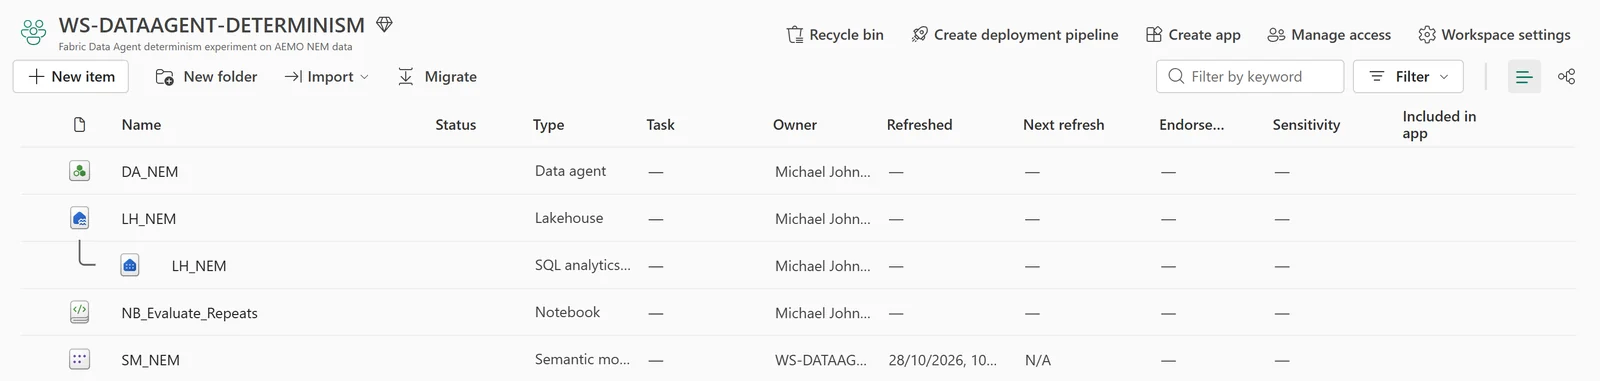
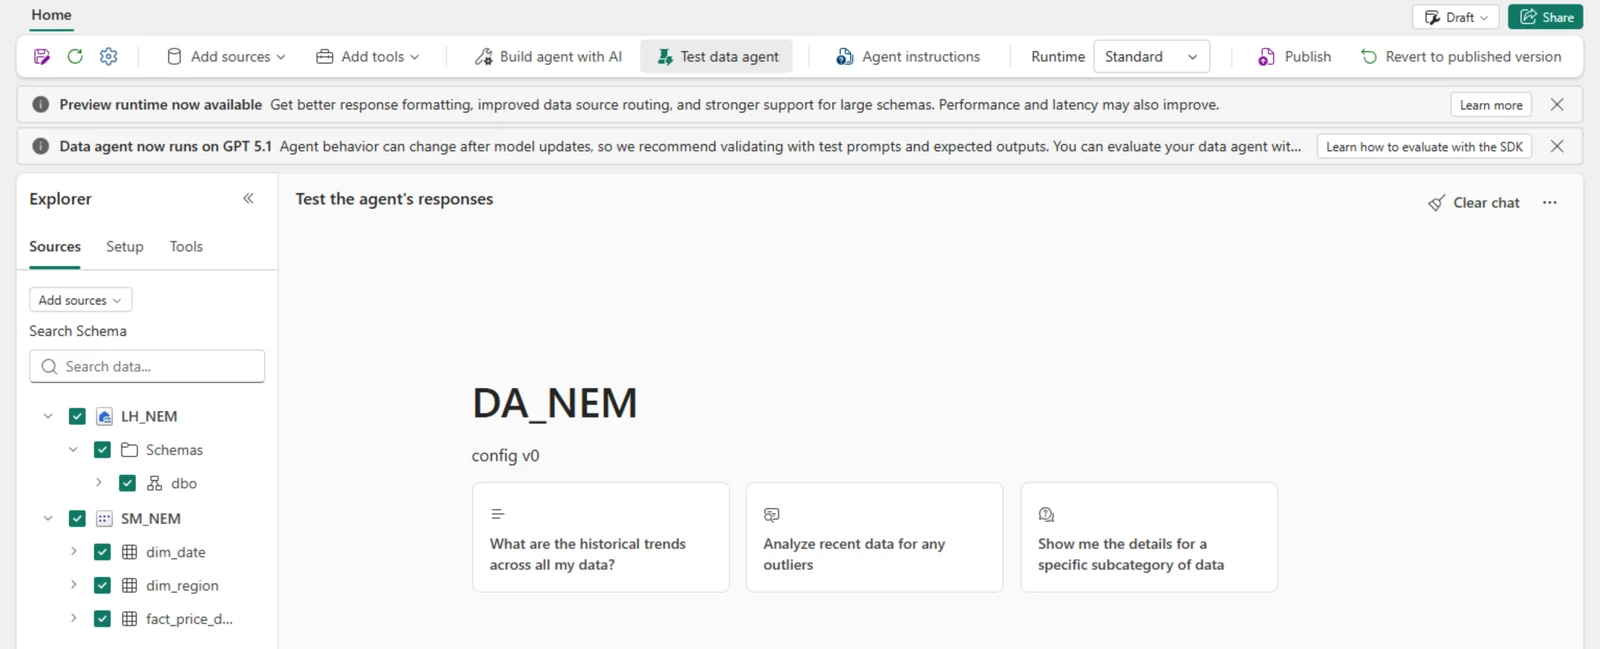
The WS-DATAAGENT-DETERMINISM workspace in the Fabric portal listing the DA_NEM data agent, the LH_NEM lakehouse with its SQL analytics endpoint, the NB_Evaluate_Repeats notebook and the SM_NEM semantic model. The DA_NEM data agent in the Fabric portal with LH_NEM and SM_NEM ticked as sources, the Standard runtime selected, and Fabric's banner saying the agent now runs on GPT 5.1 and recommending validation with test prompts and expected outputs.

The questions include real traps. AEMO timestamps mark the end of each interval, so September’s last row is stamped 00:00 on 1 October. My ground truth follows the date dimension and assigns each row to the date on its stamp. “Average price” can mean the simple mean of intervals or the demand-weighted price, and for South Australia in 2025 those are $86.73/MWh and $117.95/MWh. The financial year runs July to June. Every expected value comes from a stored T-SQL query run against the SQL analytics endpoint at evaluation time (Marc’s dynamic ground truth), and all 24 matched an independent pandas recomputation from the raw CSVs exactly.

The harness calls the published agent through FabricOpenAIResponses (SDK 0.1.33a0, which added headless credentials; see how the Responses API client changed) in a new conversation for every ask. It records the rewritten question, data source, generated query and answer, and grades each answer twice: with the SDK’s judge prompt as a second turn, as evaluate_data_agent does, and with a deterministic numeric comparator. Throttled attempts were re-asked. evaluate_data_agent can repeat questions itself (num_query_repeats), and its _steps table records each tool call’s natural-language query, but it doesn’t report pass^k.

The agent ran on the Standard runtime, not the preview runtime; the API runs used F16 and the 29 October notebook and portal checks used F4. The SDK and evaluate_data_agent are in preview (0.1.33a0 is an alpha on PyPI), and these results cover 24 questions on one dataset.

82% accurate, 39% dependable

Across 720 runs the agent was right 82.4% of the time. Scored one pass at a time, the same 72 wordings came in anywhere from 73.6% to 86.1%. And only 28 of the 72 wordings were right on all ten runs. Forty were flaky: right on some runs, wrong on others, with nothing changed in between.

Pass rate per question across repeated runs Config v0 · each dot is one wording of the question · 10 fresh conversations per wording 0% 25% 50% 75% 100% ← flaky: right on some runs, wrong on others → LOOKUP L1 NSW peak demand 2025 L1 wording 1: "What was the peak demand in NSW1 in calendar year 2025?" (9 correct, 1 declined) L1 wording 2: "Highest 5-minute demand recorded in New South Wales during 2025?" (9 correct, 1 declined) L1 wording 3: "nsw peak demand 2025" (8 correct, 2 declined) L2 SA max price Jul 2025 L2 wording 1: "What was the highest price in SA1 in July 2025?" (10 correct) L2 wording 2: "What's the maximum 5-minute spot price South Australia hit in July 2025?" (9 correct, 1 declined) L2 wording 3: "sa max price jul 2025" (10 correct) L3 VIC min price Sep 2026 L3 wording 1: "What was the lowest price in VIC1 in September 2026?" (10 correct) L3 wording 2: "How low did the Victorian spot price go in September 2026?" (10 correct) L3 wording 3: "vic min price sep 2026" (10 correct) L4 SA negative intervals Sep 2026 L4 wording 1: "How many 5-minute intervals had a negative price in SA1 in September 2026?" (10 correct) L4 wording 2: "In September 2026, how many dispatch intervals in South Australia cleared below zero?" (9 correct, 1 declined) L4 wording 3: "count negative price intervals sa sep 2026" (9 correct, 1 declined) L5 VIC peak demand Jun 2026 L5 wording 1: "What was the peak demand in VIC1 in June 2026?" (10 correct) L5 wording 2: "What was Victoria's highest demand in June 2026?" (9 correct, 1 declined) L5 wording 3: "vic peak demand june 2026" (10 correct) L6 QLD max price Jan 2026 L6 wording 1: "What was the highest price in QLD1 in January 2026?" (10 correct) L6 wording 2: "What was the top spot price in Queensland in January 2026?" (10 correct) L6 wording 3: "qld max price jan 2026" (9 correct, 1 declined) AGGREGATION A1 TAS average demand 2025 A1 wording 1: "What was the average demand in TAS1 in calendar year 2025?" (9 correct, 1 wrong) A1 wording 2: "On average, how much demand did Tasmania have across 2025?" (8 correct, 2 declined) A1 wording 3: "tas average demand 2025" (9 correct, 1 declined) A2 NEM negative intervals FY2026 A2 wording 1: "How many negative price intervals were there across all NEM regions in FY2026?" (10 correct) A2 wording 2: "Across the whole NEM, how many region-intervals had a negative price in the 2025-26 financial year?" (9 correct, 1 declined) A2 wording 3: "total negative price intervals all regions fy2026" (9 correct, 1 declined) A3 SA intervals over $300, 2025 A3 wording 1: "How many intervals in SA1 had a price above 300 AUD/MWh in calendar year 2025?" (10 correct) A3 wording 2: "In 2025, how many times did South Australia's 5-minute price exceed $300/MWh?" (9 correct, 1 wrong) A3 wording 3: "sa intervals over $300 in 2025" (7 correct, 3 declined) A4 Most negative prices, Jul–Sep 2026 A4 wording 1: "Which region had the most negative price intervals between July and September 2026?" (10 correct) A4 wording 2: "From July to September 2026, which NEM region recorded the most intervals with negative prices?" (9 correct, 1 declined) A4 wording 3: "region with most negative prices jul-sep 2026" (8 correct, 2 declined) A5 NSW weekend demand 2025 A5 wording 1: "What was the average demand in NSW1 on weekends in calendar year 2025?" (10 correct) A5 wording 2: "How much demand did New South Wales average on Saturdays and Sundays in 2025?" (9 wrong, 1 declined) A5 wording 3: "nsw weekend average demand 2025" (10 correct) A6 NSW month of peak, 2025 A6 wording 1: "Which month in calendar year 2025 had the highest peak demand in NSW1?" (10 correct) A6 wording 2: "In 2025, in which month did New South Wales hit its highest demand?" (8 correct, 2 declined) A6 wording 3: "nsw month of max demand 2025" (10 correct) TIME SEMANTICS T1 VIC average demand FY2025 T1 wording 1: "What was the average demand in VIC1 in FY2025?" (9 correct, 1 declined) T1 wording 2: "What was Victoria's average demand for the 2024-25 financial year?" (9 correct, 1 declined) T1 wording 3: "vic avg demand fy2025" (9 correct, 1 wrong) T2 QLD peak demand ‘last quarter’ T2 wording 1: "What was the peak demand in QLD1 last quarter?" (8 correct, 1 wrong, 1 declined) T2 wording 2: "What was Queensland's highest demand over the last quarter?" (9 wrong, 1 correct) T2 wording 3: "qld peak demand last quarter" (5 wrong, 5 correct) T3 VIC negative intervals ‘last month’ T3 wording 1: "How many negative price intervals did VIC1 have last month?" (9 correct, 1 wrong) T3 wording 2: "Last month, how many 5-minute intervals in Victoria had negative prices?" (9 correct, 1 wrong) T3 wording 3: "vic negative intervals last month" (7 correct, 3 wrong) T4 NSW price at 18:00, 15 Jan 2026 T4 wording 1: "What was the NSW1 price for the 5-minute interval ending at 18:00 on 15 January 2026?" (10 correct) T4 wording 2: "What was the New South Wales spot price at 6pm on 15 January 2026?" (9 correct, 1 declined) T4 wording 3: "nsw price 15 jan 2026 18:00" (10 correct) T5 NSW energy on 1 Sep 2026 T5 wording 1: "How much energy in MWh did NSW1 consume on 1 September 2026?" (6 correct, 3 declined, 1 wrong) T5 wording 2: "What was New South Wales' total energy demand on 1 September 2026, in MWh?" (9 correct, 1 declined) T5 wording 3: "nsw energy mwh 1 sep 2026" (9 correct, 1 declined) T6 SA peak demand, Q2 of FY2026 T6 wording 1: "What was the peak demand in SA1 in Q2 of FY2026?" (10 correct) T6 wording 2: "What was South Australia's highest demand in the second quarter of the 2025-26 financial year?" (10 correct) T6 wording 3: "sa peak demand fy26 q2" (10 correct) DEFINITIONAL D1 Highest average price, FY2026 D1 wording 1: "Which region had the highest average price in FY2026?" (10 correct) D1 wording 2: "In the 2025-26 financial year, which NEM region was the most expensive on average?" (10 correct) D1 wording 3: "highest avg price region fy2026" (10 correct) D2 SA average price 2025 D2 wording 1: "What was the average price in SA1 in calendar year 2025?" (9 alternative: simple avg, 1 declined) D2 wording 2: "What did South Australian wholesale power cost on average in 2025?" (10 alternative: simple avg) D2 wording 3: "sa average price 2025" (9 alternative: simple avg, 1 declined) D3 NEM average price Sep 2026 D3 wording 1: "What was the average price across the NEM in September 2026?" (6 correct, 3 alternative: simple avg, 1 wrong) D3 wording 2: "What was the NEM-wide average wholesale price in September 2026?" (7 alternative: simple avg, 3 correct) D3 wording 3: "nem average price sep 2026" (8 alternative: simple avg, 2 correct) D4 VIC total demand May 2026 D4 wording 1: "What was the total demand in VIC1 in May 2026?" (6 correct, 3 declined, 1 alternative: sum mw) D4 wording 2: "How much electricity did Victoria use in total in May 2026?" (10 correct) D4 wording 3: "vic total demand may 2026" (10 correct) D5 SA hours of negative prices 2025 D5 wording 1: "How many hours of negative prices did SA1 have in calendar year 2025?" (8 correct, 1 wrong, 1 declined) D5 wording 2: "In 2025, for how many hours were South Australian prices negative?" (7 correct, 2 alternative: distinct clock hours, 1 declined) D5 wording 3: "sa negative price hours 2025" (8 correct, 1 wrong, 1 declined) D6 Cheapest region Q2 2026 D6 wording 1: "Which region was the cheapest in Q2 2026?" (9 correct, 1 declined) D6 wording 2: "Which NEM region had the lowest average price in the second quarter of 2026?" (9 correct, 1 declined) D6 wording 3: "cheapest region q2 2026" (10 correct) always right flaky never right a grey bar joins the wordings of one question when they disagree
Figure 2. Pass rate for each of the 72 wordings over ten fresh conversations, config v0. Teal dots were right every time, amber dots were flaky and red dots were never right. A grey bar joins the three wordings of a question when they disagree. Hover a dot for the wording and its outcome counts.

The metric that captures this is pass^k from the τ-bench paper: the chance that all k independent attempts at a task succeed, averaged across tasks. Pass^10 here is 38.9%.

pass^k: the chance a question is answered correctly on every one of k asks Averaged over all wordings; unbiased estimator from the repeated runs (k=1 is ordinary accuracy) 20% 30% 40% 50% 60% 70% 80% 90% 100% 1 2 3 4 5 6 7 8 9 10 k = number of times the same question is asked v0: pass^1 = 82.4% v0: pass^2 = 74.3% v0: pass^3 = 67.8% v0: pass^4 = 62.3% v0: pass^5 = 57.5% v0: pass^6 = 53.1% v0: pass^7 = 49.2% v0: pass^8 = 45.5% v0: pass^9 = 42.1% v0: pass^10 = 38.9% v0 pass^10 = 38.9% v0 82.4% v1: pass^1 = 85.0% v1: pass^2 = 76.5% v1: pass^3 = 70.4% v1: pass^4 = 65.6% v1: pass^5 = 61.1% v1 pass^5 = 61.1% v1 85.0%
Figure 3. Pass^k falls steadily as you ask the same question more times. The v1 configuration starts higher and falls at almost the same rate, so better instructions raised the curve without flattening it.

Only 3 of the 24 questions were right every time under all three wordings.

The variance enters before the query is written

The Responses API returns every tool call. In the trace, the orchestrator rewrites the question into a fuller instruction, picks a source, generates and runs a query, then writes the answer.

ONE ASK · WHAT VARIED ACROSS 10 FRESH RUNS OF THE SAME WORDING (V0, 72 WORDINGS) DECIDED HERE Question same text Rewrite fuller instruction to the tool Route lakehouse or semantic model Query generated DAX Answer number + words Verdict right or wrong ~every run median 10 distinct rewrites per 10 runs 717 / 720 runs picked the semantic model median 9 distinct DAX texts, mostly harmless 21 / 72 wordings gave more than one number 17 / 72 wordings flipped right ↔ wrong Declined: 42 runs (5.8%) · the tool produced no query Variance is everywhere upstream; most of it washes out. The rewrite fixes the interpretation, and the DAX then executes it faithfully.
Figure 4. Where the variance enters, config v0. Rewrites and DAX text vary on almost every run; far fewer wordings end up with a different number or verdict.

The rewrite and the DAX text differed on almost every run, yet most of that variation is harmless: aliases, column choices and formatting that return the same number. Routing barely moved. Only 3 of 720 runs touched the lakehouse, even though it was attached.

In the two questions I traced end to end, what decided the answer was the rewrite. For the Queensland question, runs whose rewrite said “the most recent calendar quarter available in the data” returned the 1 October interval; runs that said “the last completed calendar quarter relative to today” returned the right peak. That one phrase predicted the outcome in 26 of 29 answered runs. For “the average price across the NEM in September 2026”, the agent used the demand-weighted measure in all 11 runs where the rewrite contained the word “weighted”, and the simple-average measure in 18 of the 19 where it didn’t.

Takeaway

Generated query text is the wrong thing to diff between runs. Log the rewritten question. It’s where an ambiguous request becomes a specific one, and it’s the first step your instructions influence.

Four ways it went wrong

Definitional drift. In v0, 27% of definitional runs returned a defensible number under a different definition, usually the simple average where the business meant demand-weighted. Every South Australia 2025 run that produced a query (28 of 30) used the measure literally named [Average Price], and six of those answers described the result as “volume-weighted”. The label matched the business definition and the number didn’t, which is exactly how a wrong answer gets past a reviewer.

The portal’s test chat found a third reading. With the v0 settings in the draft, “What was the average price across the NEM in September 2026?” came back as $53.63/MWh, labelled volume-weighted, five times in a row. That is the unweighted mean of the five regional demand-weighted prices, which counts Tasmania the same as New South Wales. It never appeared in any of the 45 API runs of that question. (The test chat keeps one thread, so those answers could see each other.)
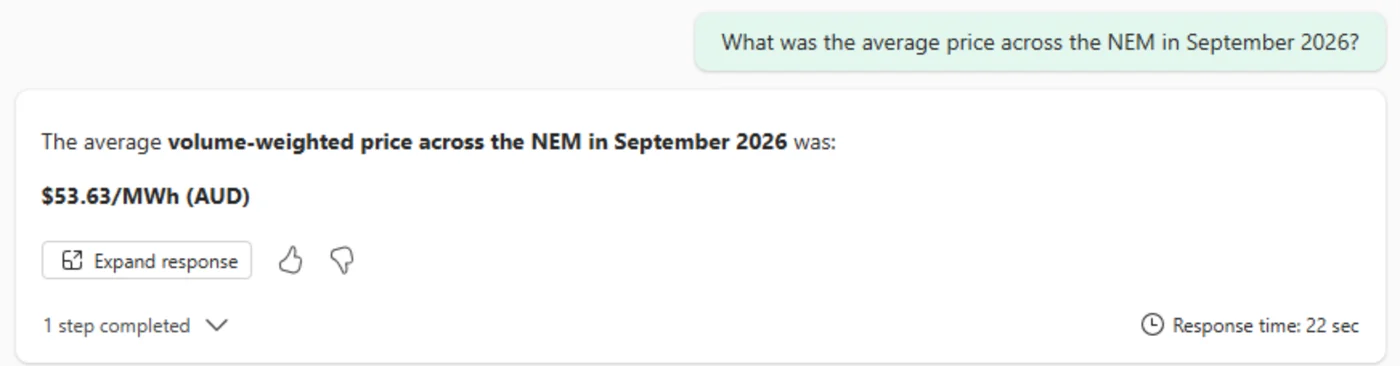
The Fabric data agent test chat answering What was the average price across the NEM in September 2026 with: The average volume-weighted price across the NEM in September 2026 was $53.63/MWh (AUD).

Data-edge artefacts. The single 00:00 interval on 1 October exists because AEMO stamps interval ends. Half the Queensland runs treated it as a quarter of data, and the portal chat went further, reporting the period covered as 1 October to 31 December 2026.
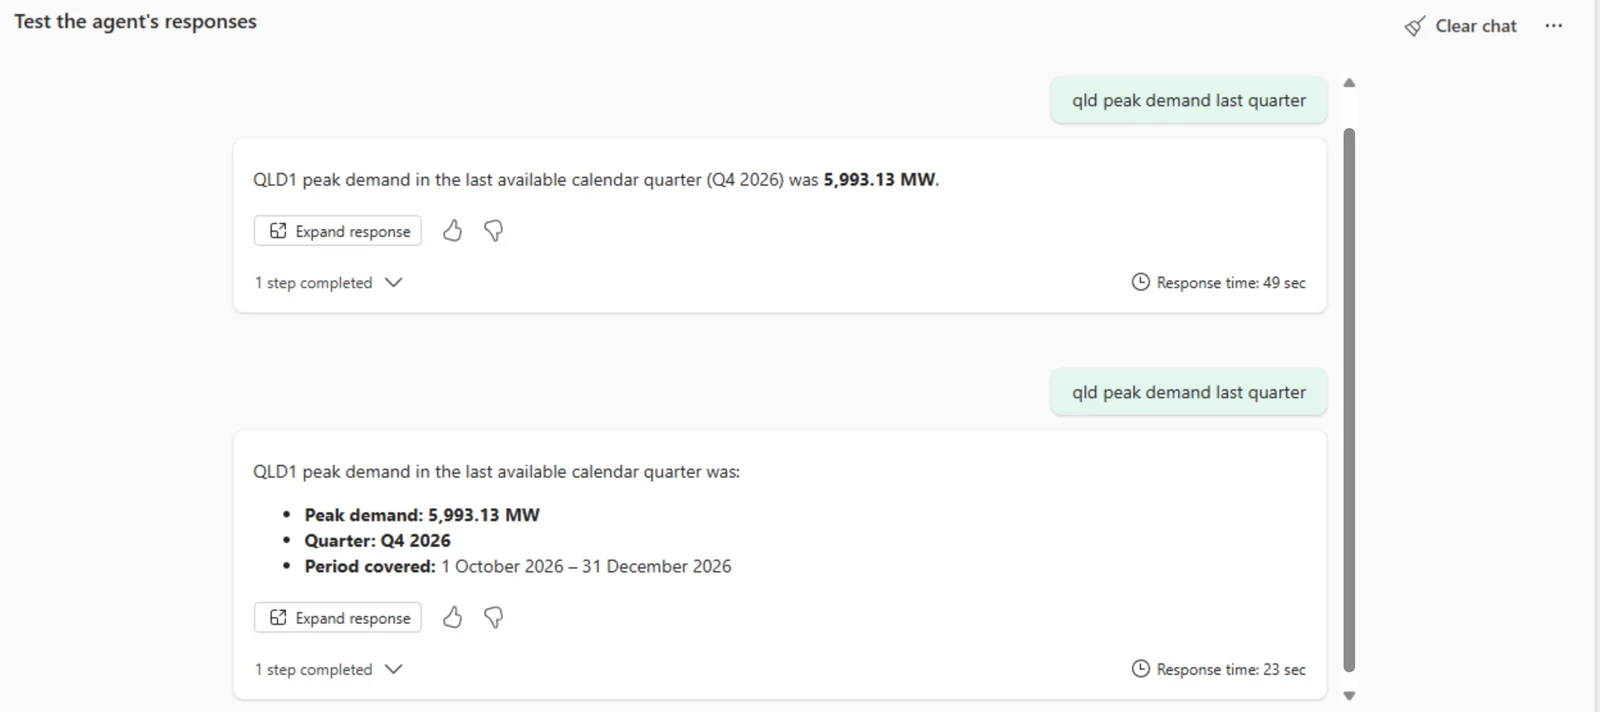
The Fabric data agent test chat answering qld peak demand last quarter twice: 5,993.13 MW in the last available calendar quarter, Q4 2026, period covered 1 October 2026 to 31 December 2026.

Prior knowledge leaking in. The NEM moved to five-minute settlement on 1 October 2021. Eight rewrites still described half-hourly or 30-minute intervals, and two answers to “how many hours of negative prices” divided the interval count by two, returning 15,940 hours instead of 2,656.7.

Declines. In 42 runs (5.8%) the semantic model tool produced no query, and the agent said so rather than guessing. That’s the right failure, but it hit 32 of the 72 wordings, so it shows up as flakiness on otherwise reliable questions.

What the wrong answers actually were Share of all runs per category · 'defensible' = matches an alternative reading (e.g. simple vs demand-weighted average) Lookupv0 Lookup v0: correct 95% of 180 runs 95% Lookup v0: declined (no query produced) 5% of 180 runs Lookupv1 Lookup v1: correct 94% of 90 runs 94% Lookup v1: wrong 1% of 90 runs Lookup v1: declined (no query produced) 4% of 90 runs Aggregationv0 Aggregation v0: correct 86% of 180 runs 86% Aggregation v0: wrong 6% of 180 runs 6% Aggregation v0: declined (no query produced) 8% of 180 runs 8% Aggregationv1 Aggregation v1: correct 76% of 90 runs 76% Aggregation v1: wrong 16% of 90 runs 16% Aggregation v1: declined (no query produced) 9% of 90 runs 9% Time semanticsv0 Time semantics v0: correct 83% of 180 runs 83% Time semantics v0: wrong 12% of 180 runs 12% Time semantics v0: declined (no query produced) 5% of 180 runs Time semanticsv1 Time semantics v1: correct 81% of 90 runs 81% Time semantics v1: defensible, different definition 1% of 90 runs Time semantics v1: wrong 16% of 90 runs 16% Time semantics v1: declined (no query produced) 2% of 90 runs Definitionalv0 Definitional v0: correct 66% of 180 runs 66% Definitional v0: defensible, different definition 27% of 180 runs 27% Definitional v0: wrong 2% of 180 runs Definitional v0: declined (no query produced) 6% of 180 runs 6% Definitionalv1 Definitional v1: correct 89% of 90 runs 89% Definitional v1: defensible, different definition 8% of 90 runs 8% Definitional v1: wrong 1% of 90 runs Definitional v1: declined (no query produced) 2% of 90 runs correct defensible, different definition wrong declined (no query produced)
Figure 5. Outcome mix by question category. In v0 the definitional failures are mostly defensible alternative readings. In v1 most of those become correct, while aggregation picks up new wrong answers.

What instructions fixed, and what they broke

For v1 I did what the guidance suggests: definitions in the agent instructions, data source instructions naming the right measure for each term, and three example queries on the lakehouse. Every wording ran five times, compared with v0’s first five runs.

v1 agent instructions (excerpt)
- "Average price" means the demand-weighted (volume-weighted) average:
  SUM(rrp * demand) / SUM(demand). Say that you used the demand-weighted average.
- "Peak demand" means the highest 5-minute total demand in MW.
- Financial year means the Australian financial year, 1 July to 30 June.
- settlement_date is the END of each 5-minute interval in AEST (UTC+10, no daylight saving).
- Report prices to 2 decimal places and demand to 1 decimal place. Give one final number per question.
Five runs per wordingv0v1
Accuracy (pass^1)81.7%85.0%
Wordings right on all five runs37 of 7244 of 72
Definitional questions correct66.7%88.9%
Aggregation questions correct85.6%75.6%
Wrong answers (not alternative definitions)5.0%8.3%
Wordings flipping right/wrong among answered runs1015
Runs routed to the lakehouse2 of 36045 of 360

The definitions worked where they were aimed. South Australia’s 2025 average price went from 0 correct in 15 runs to 12 of 15. They also leaked into questions about average demand: 16 of 45 rewrites asked for a “demand-weighted average demand”, against none in v0, and the agent dutifully computed one. Tasmania’s 2025 average demand came back as 1,069.0 MW instead of 1,049.7 MW in seven of 15 runs. Aggregation accuracy fell ten points.

The routing hint sent all 15 timestamp lookups to the lakehouse, and the 45 lakehouse runs were right 91% of the time. The Queensland “last quarter” question got no instruction, and two of its three wordings were wrong on all five v1 runs.

Watch for

An instruction is a global edit to every rewrite the agent will ever make. After changing one, re-run the whole distribution, not just the questions you meant to fix. Here the mean went up 3.3 points, but a bootstrap over the 72 wordings puts the 95% interval at −3 to +10 points, while the number of flipping wordings went up by half. The category shifts are the real signal.

Microsoft’s own tooling reproduces the label problem. I put three of the shakiest v1 wordings through evaluate_data_agent in a Fabric notebook, with num_query_repeats=5 against the published v1 agent. It marked 12 of 15 answers as not matching, one right in five for each question. Three South Australia answers read “the demand-weighted average price … was $86.73/MWh”, and four NEM answers gave $47.16 the same way: the instruction’s label on the simple average. The SDK’s own _steps table shows how, with a rewrite asking for “the NEM-wide demand-weighted average wholesale price … using the predefined Average Price measure”.
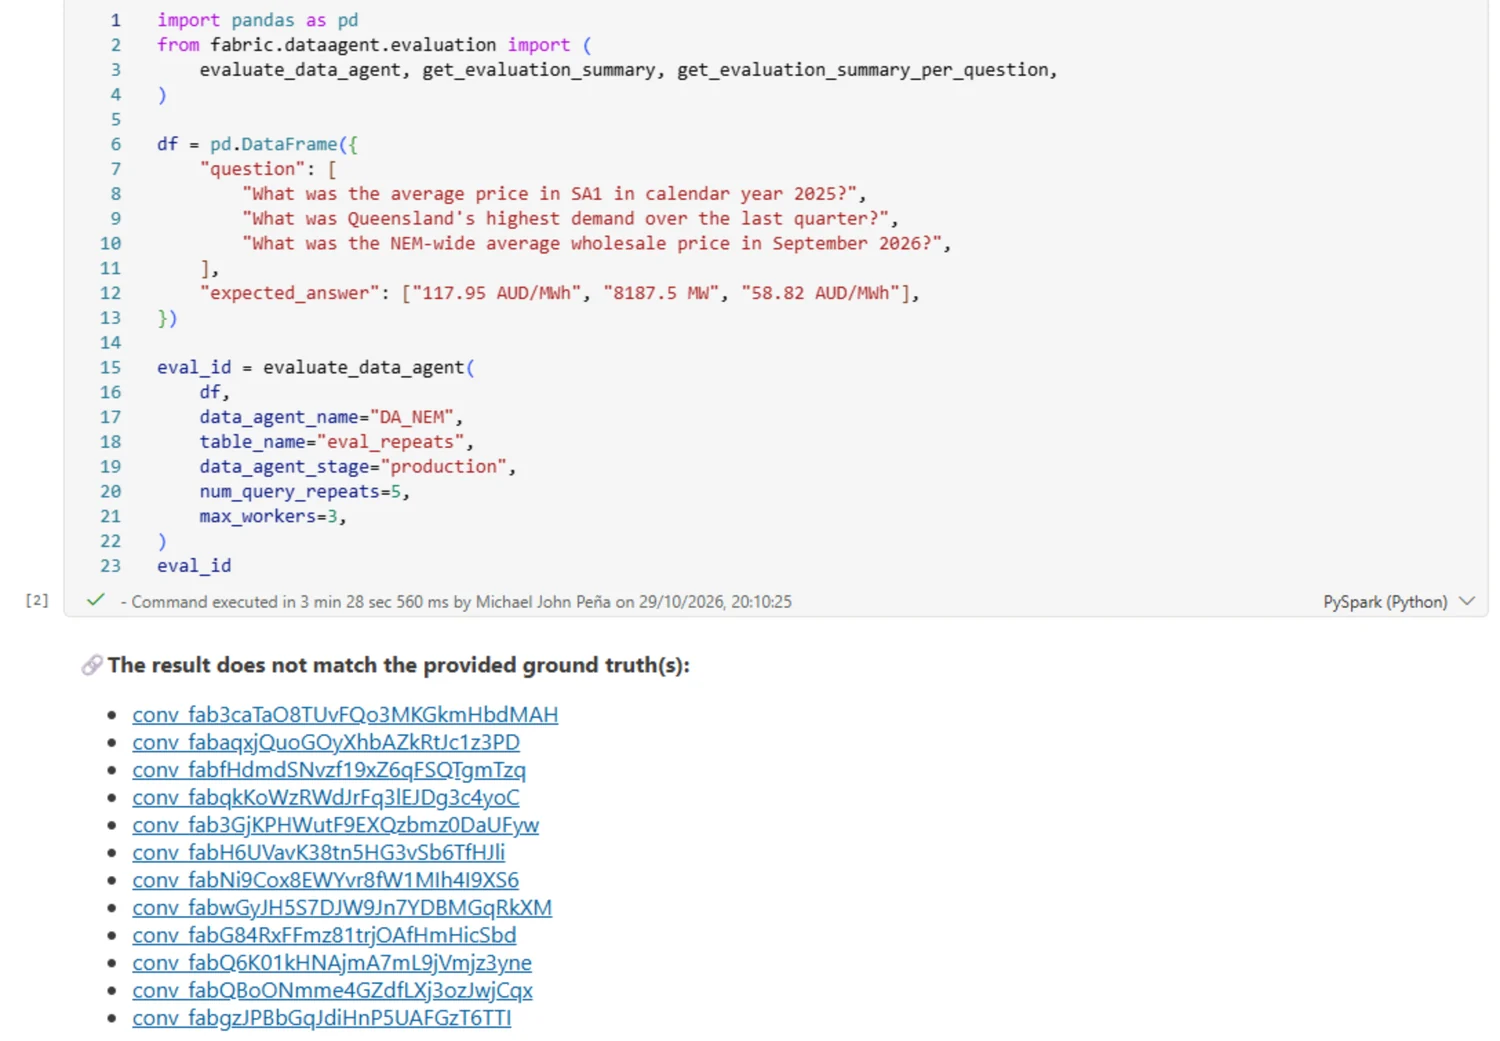
A Fabric notebook cell running evaluate_data_agent with num_query_repeats=5 against DA_NEM, followed by the SDK output listing twelve conversation links under: The result does not match the provided ground truth(s).

The judge held up, with two sharp edges

I expected the SDK’s judge to be a source of noise. It wasn’t. Across all 1,080 runs in both configurations it replied with a bare “Yes”, “No” or “Unclear”. Its verdict matched my deterministic comparator on 1,079 runs; the other was a single “Unclear” on a wrong answer. To test the judge on its own, I held 60 stored v1 answers fixed (30 correct, 30 not) and re-ran the judge five times on each by branching off the stored answer with previous_response_id. All 300 replays returned the original verdict.

Two details in 0.1.33a0 are still worth knowing. First, the judge is the data agent itself: evaluate_data_agent sends the grading prompt as a second message in the same conversation, and the default prompt asks about “the most recent answer”. The verdict is then parsed with "no" in message.lower() before checking for “yes”, so a judge that ever says “Yes, but note…” scores a fail. Second, the critic_prompt example on Microsoft Learn uses an {actual_answer} placeholder the SDK never fills. It raises KeyError after the agent has answered, and because results are written only at the end, the run is lost. Here it is in a Fabric notebook, 31 seconds in:
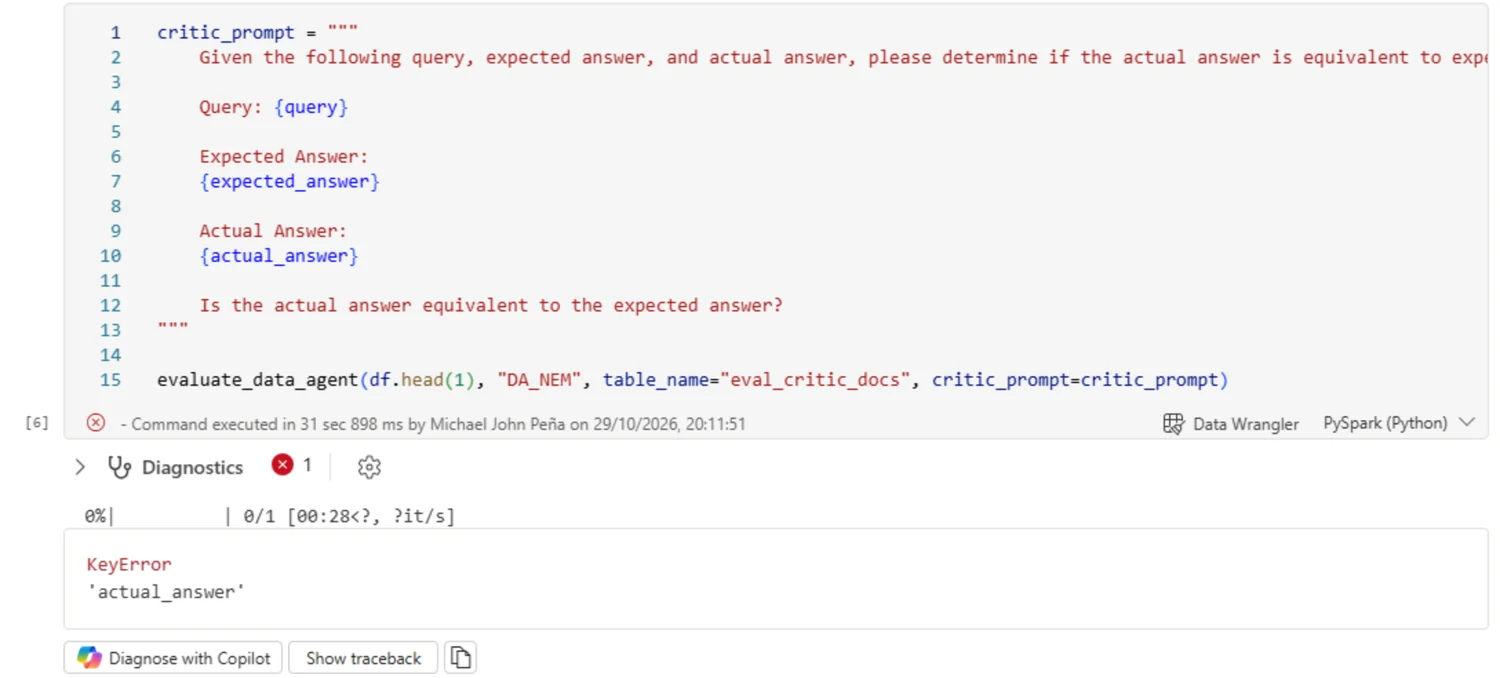
A Fabric notebook cell defining the critic_prompt example from Microsoft Learn with an actual_answer placeholder and calling evaluate_data_agent, failing with KeyError: actual_answer.

Until that changes, write a custom critic prompt the way the default one works: refer to the most recent answer and use only {query} and {expected_answer}.

The harness

repeat_eval.py
import json
from azure.identity import AzureCliCredential
from fabric.dataagent.client import FabricOpenAIResponses

client = FabricOpenAIResponses(
    artifact_name="<your-data-agent-name>",
    workspace_name="<your-workspace-id>",  # name or ID; an ID avoids lookup ambiguity
    ai_skill_stage="production",
    credential=AzureCliCredential(),  # fine for a few hundred calls; use a caching credential for more
)

def ask_fresh(question: str) -> dict:
    """One question, one brand-new conversation, every step kept."""
    conversation = client.conversations.create()
    response = client.responses.create(input=question, conversation=conversation.id)
    steps = [
        {"tool": item.name, "args": json.loads(item.arguments)}
        for item in response.output
        if item.type == "function_call"
    ]
    rewrite = next((s["args"].get("query") for s in steps if s["tool"].startswith("trace.")), None)
    code = [s["args"]["code"] for s in steps if "code" in s["args"]]
    return {"answer": response.output_text, "rewrite": rewrite, "code": code}

runs = [ask_fresh("What was Queensland's highest demand over the last quarter?") for _ in range(10)]
client.close()

Tool names like trace.analyze_semantic_model aren’t a documented contract; print your own agent’s item types first.

The pass^k estimator is one line per question wording:

from math import comb

def pass_hat_k(n: int, correct: int, k: int) -> float:
    """Unbiased estimate that k independent asks are all correct (tau-bench)."""
    if k > n:
        raise ValueError("k must be <= n")
    return comb(correct, k) / comb(n, k)

What I’d do on Monday

  • Run every evaluation question at least five times in fresh conversations, and report pass^5 next to accuracy. evaluate_data_agent takes num_query_repeats and logs the rewrite in the function_queries column of its _steps table, so pass^k is a group-by over its output, not a custom harness.
  • Ask each important question in two or three wordings. Wording moved the Queensland question from 8 in 10 right to 1 in 10.
  • Name measures for their definition. Without instructions, 101 of 120 average-price runs picked the measure called Average Price.
  • Write definitions into the agent instructions and back them with example queries, then rerun the same distribution, not a single pass.
  • Grade numbers with a deterministic comparator, and keep the LLM judge for wording.
  • Treat a decline as a failure in your metric but a safe one in your risk review.

Your data agent is still only as good as your data, as Marc says. It is also only as dependable as its least stable rewrite, and you won’t see that until you ask the same question more than once.

Michael John Peña

Michael John Peña

Data & AI Director and Microsoft MVP based in Sydney. Writing about Microsoft Fabric, Azure, data engineering, and AI.